

Policy Exchange’s partial analysis of the impact of Brexit on trade

This is a longer version of a short blog I wrote for UK In A Changing Europe. They rightly made me stick to their strict word count. I’m grateful to UKICE’s Joël Reland for publishing that piece (all views are mine, of course). You should all follow him on Bluesky here.
In a new Policy Exchange report, endorsed by former Chancellor Jeremy Hunt, Phil Radford argues that the impact of Brexit on goods exports is “only a small fraction of what has been assumed”. But the evidence he presents for that assertion is partial. As so often with these rebuttals from pro-Brexit analysts, the piece offers no competing model to estimate the impact – as people say, ‘it takes a model to beat a model’. His paper focuses on goods exports – thereby ignoring Brexit’s impact on imports, services trade, investment, consumption and migration (which is largely negative). But even if we only consider goods exports, a more nuanced view of the evidence suggests that Brexit has had a sizeable negative impact.
Of the claims that Radford makes, three are most important to his argument. First, by focusing on export volumes, not values, previous studies have overstated Brexit costs. They haven’t taken account of the fact that, for example, the number of British cars exported have slumped, but the values have recovered – and this is down to growing exports of more expensive Land Rovers and other premium cars, especially to the US. Second, non-Brexit shocks have had a uniquely bad impact on the UK’s export mix, so comparing the UK to other countries is misleading. Third, slow growth of goods exports before Brexit suggest that the EU was not beneficial to UK trade. Let’s take each in turn.
The Office of Budget Responsibility, the UK’s fiscal watchdog, said last year that the evidence on trade since Brexit is consistent with its forecast – that in the long term, trade volumes will be 15% lower as a share of GDP than if the UK had stayed in the EU. Radford argues – with good reason – that values also matter: if Britain exports less stuff, but its value grows faster than the volume drops, national income will be higher, all else being equal. And the value of car exports have been recovering from the pandemic-Brexit slump – by 2023, they were only 2% below 2019 levels.
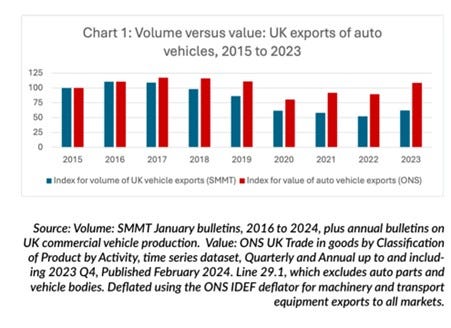
But if Brexit hadn’t happened, the recovery car exports might have been greater. The chart above does not isolate the effect on exports due to a shift towards premium cars, or Brexit. Inflation complicates the picture further. Radford does ‘deflate’ his trade value data to account for this, but other countries also saw falling car export volumes and rising values, as one would expect during a stagflationary period.
The big car manufacturing countries in Europe can provide a check on Radford’s analysis, because, rather obviously, these countries did not leave the EU, but they also suffered from supply disruptions from the pandemic and weak demand as inflation and interest rates rose (see Chart 2 below).
Germany has had a similar slump in the number of cars exported as the UK, while Spain’s hasn’t been as bad (France and Italy don’t count units exported). So it appears the shift towards the export of more expensive cars is common to the UK, Germany and Spain. And values have held up better than Britain, with Germany’s 2023 value up by 6% on its 2019 level, Spain up by 18%, and Italy 16%. France’s 2023 value was the same as 2019. (I used a similar deflation method as Radford to try to control for inflation.)
Chart 2. Automotive export volumes and values in European countries with large car sectors.

Sources: UN Comtrade (export values, heading HS 8703 – passenger vehicles), Eurostat (PPI deflator for transport equipment), German and Spanish automobile associations (number of cars exported).
Note: Values are deflated using Eurostat’s PPI deflator for transport equipment (sts_inpp_m). Thank you to UKICE for making the charts in this post.
Radford is absolutely right to point argue that we should consider both values and volumes. But on both metrics Britain appears to have performed worse than other countries with big automotive sectors.
Moving on to the second claim, the Policy Exchange report argues that comparing the UK to other countries is not useful, because Britain’s unusual export mix means it has performed poorly. The ’synthetic control’ method – AKA the ‘doppelgänger’ method – has been controversial, and Radford argues that my work and others’ are not comparing like with like, because cars and aeroplanes make up a larger share of the UK’s total, compared to the G7, and those sectors have suffered from weak global demand in recent years, owing to the pandemic and inflation. The UK’s export mix, therefore, made it uniquely vulnerable to non-Brexit shocks.
The doppelgänger method uses a weighted basket of advanced economies (not just the G7) whose trade performance was most similar to that of the UK before Brexit. The basket provides a counterfactual Britain that did not leave the single market and customs union. According to my variant of it, UK goods exports were lagging the doppelgänger by 13% in the second quarter of 2023. Jun Du and colleagues’ variant has exports to the EU down by 23% and to the rest of the world by 12% in March 2022.
The method uses an algorithm to select the weighted basket of countries from 23 advanced economies – and the UK’s export mix is reflected in the countries the algorithm selects. The countries chosen are, in order of weight, Norway (23%), the US (19%), Germany (17%) and France (11%) with several other countries with shares lower than 5%. Why is Norway in there? Because Norway is an oil and gas exporter, like the UK, so its total goods trade values are affected by international hydrocarbon prices. Similarly, the US, Germany and France are selected because they have sizeable car and aerospace sectors, like the UK, and so global demand and supply shocks to those sectors are reflected in total goods trade values the pre-Brexit period. Since trade fluctuates over time, the method seeks to find countries whose goods exports change in parallel to those of the UK’s, and because export mixes drive changes in total exports, a combination of countries are chosen that reflect the UK mix.
And as Chart 3 below shows, the change in the doppelgänger’s automotive share of total exports moved in a similar way to the UK’s until 2019, when it became clear that a free trade agreement or no deal were the only likely options. From 2020, the UK’s share declined, while the doppelgänger’s held steady, suggesting that Brexit was to blame for the declining importance of car exports – and that a large proportion of the overall losses from Brexit are being driven by the automotive sector. As the top right hand of the panel shows, this dynamic was unique to the UK – apart perhaps from Spain, whose automotive share recovered in 2023.
Chart 3. Automotive and aerospace shares of total goods exports, UK and countries that make up the doppelgänger.
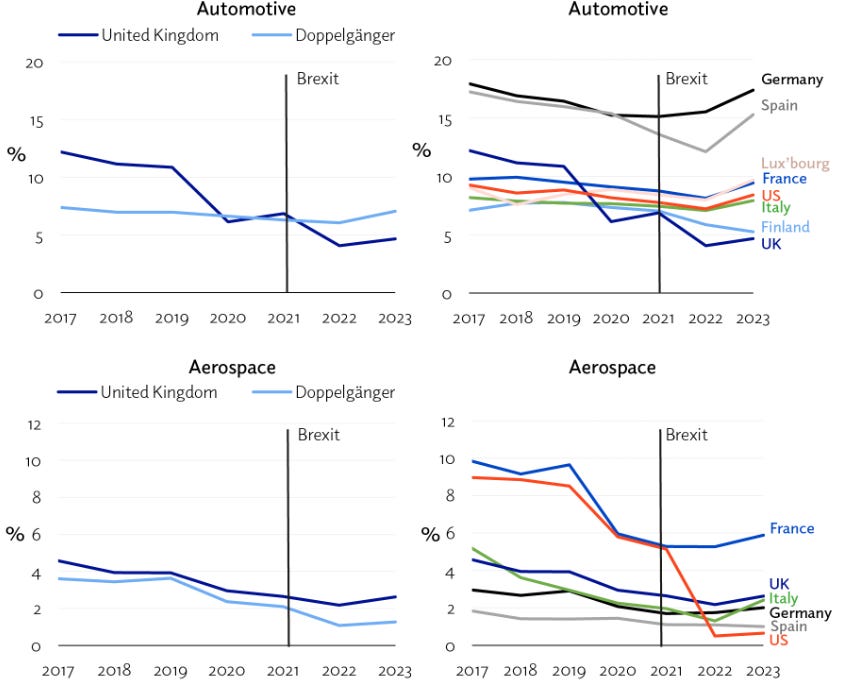
Sources: UN Comtrade (export values, HS chapters 87 and 88 as a share of total goods exports), John Springford, ‘Brexit, four years on: Answers to two trade paradoxes’, Centre for European Reform, January 2024 (synthetic control).
As for aerospace, Radford is right that it doesn’t appear to be Brexit driving the decline in exports – if anything, the doppelgänger’s performance is worse. And looking across the countries in the doppelgänger that have big aerospace sectors, the decline has been universal. However, aerospace only makes up about 3% of the UK’s goods exports, so its middling performance is not enough to offset the relative losses in other sectors.
Considering the claim that the synthetic control method doesn’t account for global demand and supply problems in automotive and aerospace, then, we can see that the evidence points strongly to big Brexit effects on the former, and none in the latter.
Radford’s final claim that is that the synthetic control method does not take account of weak UK goods export growth to the EU and stronger growth to the rest of the world before Brexit. Citing a 2017 Civitas report called ‘It’s quite OK to walk away’, Radford writes that its author, Michael Burrage “discovered that the UK’s performance in terms of goods exports to the EU undershot virtually everyone else’s” despite the supposed benefits of the single market and customs union, with the implication that leaving the EU would not have much impact on exports. The doppelgänger analyses “are then attributing to Brexit what is in fact a pre-existing condition”, Radford says.
There are two problems with this argument. The first is that it confuses levels and rates of change. Every gravity model of trade finds that the level of UK goods trade with EU member-states is substantially higher than would be predicted by the size of the trade partners’ GDPs, distance from one another, and various other factors affecting trade – that is strong evidence that EU membership raised the level of UK-EU goods trade substantially. Weak UK export growth to the EU was a real problem before Brexit, but one that was caused by a range of factors, some connected to EU policy, such as Germany’s growing price competitiveness, a strong pound (before 2016), and the expansion of German supply chains in central and eastern Europe. If Britain had not been in the EU, it would still have struggled with weak export growth to the EU, because its membership was not the cause of that weakness.
The second is that, the doppelgänger analyses do not “attribute to Brexit what was a pre-existing condition”, as the following chart shows. Between 2009 and 2019, UK and doppelgänger exports grew roughly in parallel, and more strongly to non-EU markets than EU ones. After Brexit, the paths of the UK and the doppelgänger diverged, in both cases.
Chart 4. UK and doppelgänger exports to EU and non-EU markets.
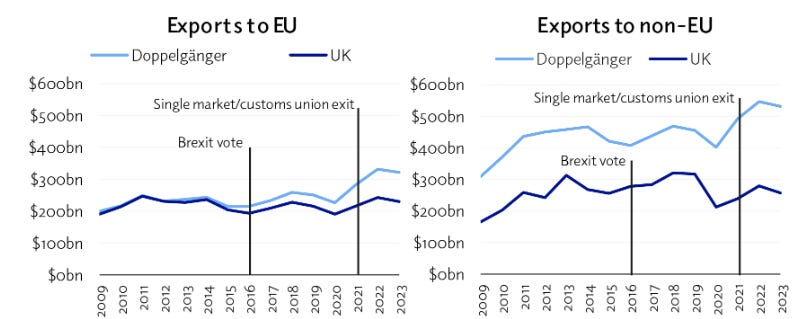
Sources: IMF Direction of Trade Statistics (export values), John Springford, ‘Brexit, four years on: Answers to two trade paradoxes’, Centre for European Reform, January 2024 (synthetic control).
Debate continues on whether Brexit has hurt goods exports to the rest of the world, as well as its exports to the EU, and whether we should count stagnant goods exports to non-EU markets as part of the impact of Brexit (more on that here, here and here). But Radford’s partial view of the evidence – and misunderstanding of how synthetic controls work – fails to back up his assertion that “existing analysis contains serious flaws”. Isolating the impact of Brexit is difficult, and we will never come to a complete consensus on the numbers, but any fair-minded appraisal points to sizeable damage to British trade.